
Civic Science Observer
Merging data from iNaturalist and eBird: Is it possible? These scientists say yes.
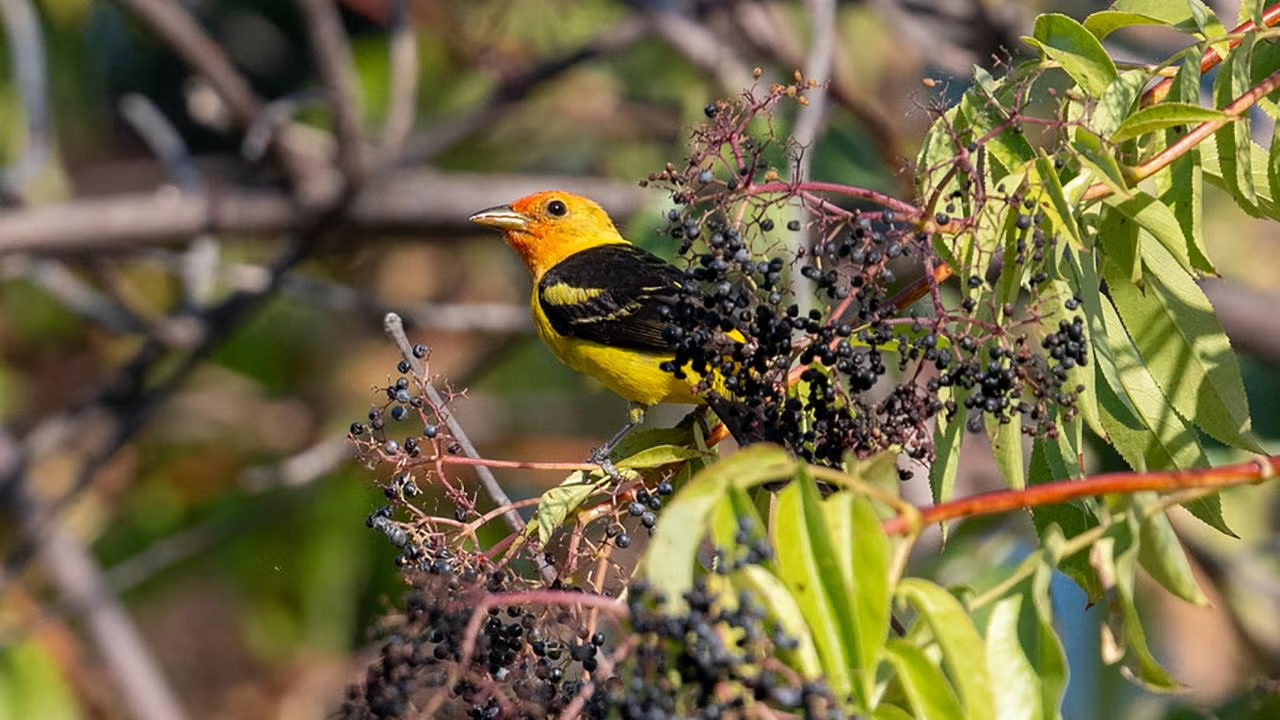
Scientists affiliated with the University of California, Davis have successfully merged data from two popular participatory science apps—iNaturalist and eBird—to capture known seasonal patterns of bird migration in Northern California and Nevada.
But getting the datasets to work together required a lot of trial and error. While iNaturalist included roughly 130,000 total observations of the bird cohort the researchers were tracking, eBird recorded more than 5 million observations of the same group, according to Cody Carroll, who began the research at UC Davis before becoming an assistant professor of mathematics and statistics at the University of San Francisco.
Carroll and his collaborators recently published their findings in Citizen Science: Theory and Practice and shared insights with The Civic Science Observer.
Laci Gerhart, an associate professor in the Department of Evolution and Ecology at UC Davis, said, “the two portals recruit different types of participants and record data in different ways and we wanted to see if those differences meant the two portals should be viewed as separate and unique data sets or if they could be combined.”
Why merge iNaturalist and eBird data?
Combining data from both apps offers scientists a richer geographic and temporal perspective than they might achieve with a smaller team collecting data independently.
“There is a longstanding tradition of amateur-conducted research studies in the field of ornithology, and there are quite a few regional ornithology publications that welcome amateur contributions,” said Rob Furrow, assistant professor of teaching in the department of Wildlife, Fish and Conservation Biology at UC-Davis.
What’s useful about eBird and iNaturalist data is that scientists can use the findings to come to a new understanding about the abundance and geographic range of a species and how things may be changing through time, according to Furrow.
“Data from a tool like eBird provide a shortcut to detailed localized knowledge about bird distribution and movement. It can allow someone to learn deep natural history information, which otherwise might take years to learn from direct field experience,” Furrow said. “For example, some ornithologists use eBird while developing research studies, choosing study sites that have a high density of a species they are interested in studying.”
A pandemic-inspired project
The idea of seeing whether researchers can merge data from eBird and iNaturalist came about during the COVID-19 pandemic, when one of Gerhart’s students, USF’s Carroll, took a class where students must complete a project in service of local and regional nature and environment organizations, according to Gerhart.
Since Carroll, who was then working on his Ph.D. in statistics, took the class during the start of the pandemic in the spring of 2020, the project needed to be conducted online or remotely. So, Carroll came up with the idea of modeling seasonality in iNaturalist records.
Carroll graduated from UC-Davis and then became a faculty member at USF. After moving to USF, he contacted Gerhart to see if he could revisit the project. But this time around, the project would see whether it was possible to combine the eBird and iNaturalist datasets because doing so would be interesting, statistically and biologically, according to Gerhart.
How the merger worked
However, merging the data required several steps, according to Carroll.
“To make them comparable, we focused instead on relative temporal frequencies, and in the process, converted our raw observation counts into density curves,” Carroll said.
The next question of whether to merge or not “translated naturally” to a hypothesis testing question, according to Carroll. “For a given species, are the density curves across eBird and iNaturalist being generated from the same underlying distribution or not? If yes, merging makes sense and allows for increased sample sizes; if not, we detect a difference and learn something interesting about the data collection biases across eBird & iNaturalist for that species.”
The next step in the experiment was constructing an appropriate test statistic, which “turned into a bit of a geometry problem,” Carroll said.
“After some trial and error and careful thinking, we landed on the circular optimal transport distance, as it respects the facts that 1) relative frequency curves are not just any curves but specifically densities, which have certain mathematical constraints, and 2) they also have a circular domain thanks to the cyclic nature of the year,” Carroll said. “Other distances fell into traps like thinking a curve which peaked in January was extremely different from a curve which peaked in December because of the artificial break in our calendar year, when in reality the signals there are pretty similar.”
The last piece of the experiment was to determine when an observed difference is too big for Carroll and others to merge for a given species. After determining the appropriate calculations, Carroll and his team repeated this process for all 254 birds before synthesizing and framing the results in an easy-to-understand way.
The benefits of using crowd-sourced data from the public
The experiment confirmed for Gerhart that crowdsourcing data can generate a much broader spatial and temporal coverage than what one research team could feasibly sample otherwise.
“The question of when is it appropriate or inappropriate is more of a methodological question to me – like all datasets, publicly generated data can have biases and gaps, so it’s appropriate to use participatory science data when it’s relevant to your research question and when any limitations, or biases, or gaps in the data are either not impactful for the question you’re asking or can be statistically accounted for in your analysis,” Gerhart said.
The collaboration between scientists and public citizens also fosters dialogue within the scientific community and beyond, according to Furrow.
“Some of this research may be conducted by professionals associated with universities or research institutes, but amateur naturalists also analyze data from these [eBird and iNaturalist] portals, which can lead to both informal publications like blog posts and formal publications like journal articles,” Furrow said.
To accompany the paper, Carroll developed a public-facing dashboard of the seasonality patterns for all the birds analyzed in the paper.
Amateur naturalists also have open access to the journal where Gerhart, Furrow and Carroll published their findings. These resources offer amateur naturalists further their own research, as well as provide professional and amateur scientists with opportunities for future collaboration.
“This aspect is a component of this work that is very important to me personally. I’m a scientist and an educator because I love learning and I love cultivating a love of learning in my students and in the public,” Gerhart said. “Participatory science projects are a great way to build curiosity and an interest in the process of science.”
She continued: “Having data and publications publicly accessible allows people to expand on that early curiosity and connect with both science and scientists. It also helps break down the idea of the academic ivory tower and the perception that scientists gatekeep our knowledge and our data.”

Joanna Marsh is a freelance writer and journalist based in Washington, D.C. For The Civic Science Observer, she reports on new developments across the citizen science landscape, covering both new research and on-the-ground practice. Her work highlights how local communities are engaging with scientists to contribute to ongoing scientific research and lessons being learned by the involved stakeholders.


Dear Colleagues: This is why science communication needs visuals

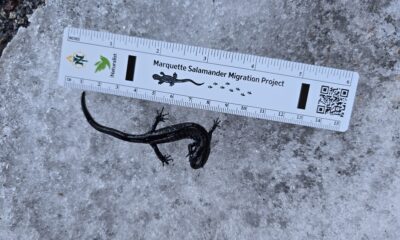
In Michigan, a citizen science project tracking salamander migration is bringing a community together and building a dataset

“Science is something that we do together.” Benjamin Richards on how OceanEyes collaborates with citizen scientists to monitor deepwater fish in Hawai’i

Dear Colleagues: Participate in a survey on barriers researchers face when communicating with non-expert audiences

Research!America selects 17 grantees from 132 applicants for the 2026 Civic Engagement Microgrant cohort
Dear Colleagues: Participate in a survey on barriers researchers face when communicating with non-expert audiences

Scott Loarie says conservation science isn’t moving fast enough. He describes how iNaturalist is helping

Photo Essay: 2026 Stand Up for Science New York City

MA3 Challenge awards grants to six universities to modernize promotion and tenure processes: Here’s the question of the day.
Research!America selects 17 grantees from 132 applicants for the 2026 Civic Engagement Microgrant cohort
“Science is something that we do together.” Benjamin Richards on how OceanEyes collaborates with citizen scientists to monitor deepwater fish in Hawai’i

Melanie Brown: “If you listen, people want to share things that are important to them.”

Abby C. King on leveraging local wisdom and science to create a thriving environment: “Our communities are the most valuable renewable resources for a healthy planet.”

Milky Way Project co-creator Grace Wolf-Chase says public engagement is ‘every bit as important as excellent scientific research’

Seeing is believing: Inside the BioBus revenue engine with Ben Dubin-Thaler
Contact
Menu
Designed with WordPress